Unifeeder

Measure your carbon emissions in just a few steps

Our carbon calculator gives you the freedom to crunch the numbers and show you the estimated CO2 emission for the entire transportation of your shipment, from pickup to final destination - whether it's rail, barge, vessel or a combined transport.

Close the calculator


A multimodal transport route couldn't be found between these cities.

Modalities
Truck
Rail
Vessel
Barge
CO2 Savings
% CO2 saved
Type of equipment
Standard 45ft container
%
CO2 saved using
multimodal vs truck only
0%

Looks like you already have a pretty good setup, but maybe you have other challenges we can help you with.

We just need a few more details from you

* All calculations are based on GLEC framework

Corporate

Actual Emission Tracker - Based on real life data

The industry practice is to use historic, generic data for calculating Greenhouse Gas (GHG) emissions. But now you can get access to your actual emissions at specific TEU level. Do you still rely on generic data for your CO2 calculations? Get real data instead with the new tool - Actual Emission Tracker.


Unifeeder has developed a State-of-the-art Actual Emission Tracker (AET)

The existing calculating methods give a good estimate but by using the comprehensive amount of data, we have access to as part of our operation, we are in fact able to set up a much more detailed and actual measurement. The Unifeeder tracker shows the emission for the actual container transport by calculating the emissions for the entire voyage and then distributing it on a container or tons level, duly considering the distance sailed by each container, weather conditions, the weight of the container, the utilization and numerous other factors.

Sign up for real life data

Unifeeder's customers can access the actual data when the voyage is complete, through direct access to the tracker or via an API integration. The emissions can be shown per container per voyage and it can be added up, showing the emission per week, month or year. It can hence be used both for individual tracking and comparison and as input to environmental accounts.

Via the Actual Emission Tracker your data is based on real life data of the actual voyage, including:

  • Routing - down to specific TEU level
  • Weather conditions
  • Actual utilization of capacity of the specific vessel
  • Simple and intuitive tool
  • Terminal handling*
  • Land-based transport*

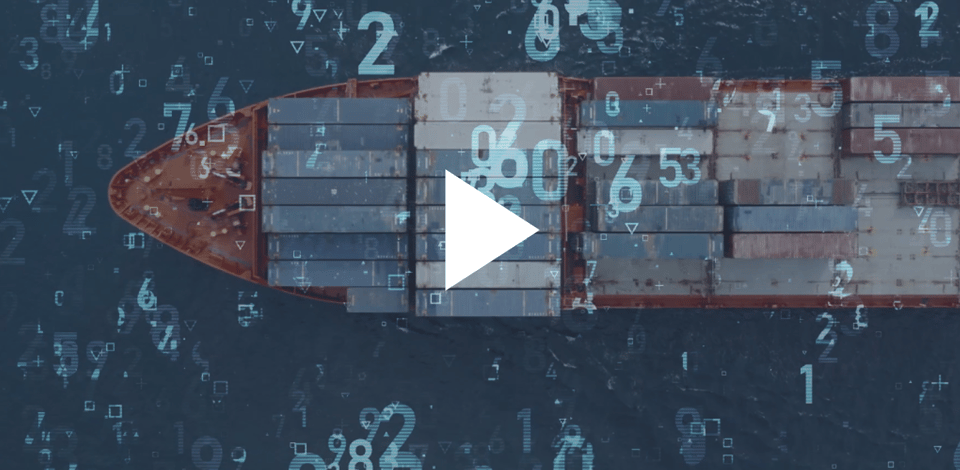
Click on the picture and watch a short explainer video!

play


*The data is precise and accurate regarding the emission stemming from the sea leg of the logistics chain. So far, emission data related to terminal handling and land-based transport is not available at the needed detail level, but Unifeeder is working persistently on obtaining such data from our suppliers. In the interim Unifeeder is relying on the international standards published in GLEC. The Tracker will be updated continuously, improving the accuracy for these parts as well.


Latest news

All News
Corporate October 18 2022 A cleaner alternative to polluting truck shunts

Collaborating with software specialist DAKOSY and DIHLA, we will facilitate environmentally friendly container transfers between the major terminals...

See more
All News
Corporate July 12 2022 Collaborating with ZeroNorth to access full suite of optimisation services

We are delighted to announce that we have signed a three-year deal with technology company ZeroNorth as part of our green agenda strategy.

See more
All News
Corporate February 8 2022 Unifeeder Group makes major decarbonization move with VARO Energy’s advanced, renewable B100 biofuel

Unifeeder has bunkered its first truly sustainable 100% biofuel from VARO Energy ("VARO") in the Port of Rotterdam.

See more
All News